
 We’ve heard it before: infographics are dead…right? While basic methods of infographic promotion have lost a bit of the link oomph, there’s still tremendous upside for brand recognition, new business acquisition, and link procurement. This mini case study breaks down the promotion process we used end-to-end and covers what worked, what didn’t, and what we’d do differently.
Concept and Research
Typically, it makes sense to ideate an infographic that’s directly or somewhat closely related to your business. In our case, SEO or eCommerce would be logical choices and likely drive more relevant links, but SEO infographics are overdone and we weren’t really focusing on links (directly). Our primary motive was to make noise in the local market and see if we could actually drive new business; links were a tertiary benefit. With that in mind, we settled on Why Everyone Is Moving to Austin, storyboarded the layout, performed the research, and started designing. We didn’t have a specific design strategy other than easy to digest and pretty enough to share.
Why That Topic?
Austin’s tech community is massive and often touted as the next Silicon Valley, but we didn’t feel the people in the space who know or care about SEO was significant enough for solid market penetration. You know what Austinites do care about? Traffic. People moving here. Jobs. Cost of living. Music. BBQ. People moving here. In fact, if you’re out and about downtown, it’s highly unlikely you won’t here someone complaining about this (usually, someone who moved here a couple years ago). We thought the idea was perfect.
The Promotion Process
We avoided nearly all of the infographic depositories and only submitted to Visual.ly. There are some decent ones, but we wanted to see how far we could get via local media and social, so those weren’t going to help much.
Sponsored Tweets
We tested some sponsored tweets via SponsoredTweets.com and didn’t see any results. 100% did not work for this and we won’t use that in the future.
r/Austin
We submitted the infographic to the Austin subreddit and were completely unsure of what was going to happen, given the number of people who think they need to keep Austin “secret.” Initially, there were a couple negative comments, but they were downvoted into oblivion and the discussion blew up quickly. The infographic reached the top of r/Austin in less than 20 minutes and stayed there for at least 10 hours. Unfortunately, we didn’t think to grab a screen capture until it dropped to #2. We submitted our own URL–which we recommend–to ensure the content was shared via our own website rather than imgur or an infographic sharing platform.
Tip: Engage with comments where appropriate and downvote rude comments from haters (this happens on its own, but extra downvotes help). Don’t respond to every comment and/or be overtly self-promotional.
Local Media
We have a list of influential Austin twitter accounts and targeted the larger news media outlets. As we expected, most were busy retweeting announcements from the police and promoting soggy journalism. The Austin Business Journal was not and gave us a nice write up that significantly bolstered content shares, as well as inbound leads from local businesses. That alone resulted in two new clients and droves of links.
Companies Included in the Infographic
We’d planned on reaching out to every company listed on the infographic, but wanted relatively measurable results from each source. In retrospect, we probably should’ve done that push at the same time, but coverage from the Austin Biz Journal managed to take care of that, resulting in links and social mentions from a significant number of companies on the infographic.
Infographic Metrics: Social Media
Facebook – 3003 engagements: 1597 likes, 629 shares, 777 comments
Reddit – 185 upvotes, 57 downvotes, 167 comments
Twitter – 245 Tweets
LinkedIn – 235 Shares
Google+ – 70 +1s
Pinterest – 41 pins
Links, Traffic, and New Business
While links weren’t the primary focus, it earned text & image links (including two .edu domains) on some really cool websites.
Noteworthy Placements
- University of Texas
- Austin Business Journal
- AMOA Graduate School of Integrative Medicine
- Invodo
- Austin Ventures
- Circular Energy
Given the subject matter, we received text and imbed links from realtors and home builders, as well as droves of realtors who used the content without citing us as the publishers or linking back via embed. While we could request a source link, we aren’t planning on reaching out to them based on relevance. We also got picked up by a few local startup blogs.
From a search perspective, it’s a range of new linking domains and natural anchors, which is great.
Traffic
We received over 25K new visits over a 10 day period, with additional traffic still hitting that page, to date.
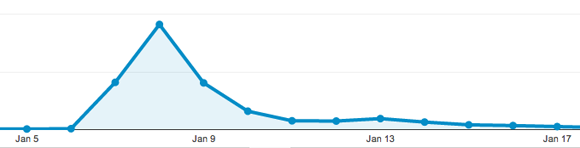
Social media easily sent the most traffic, with mobile Facebook traffic leading the pack. Bounce rate of social traffic to infographics is typically quite high and converts poorly. This particular promotion had a whopping 89.76% bounce rate, 1.16 pages/visit, and an average visit duration of 30 seconds. In most cases, we’d be disappointed, but given the subject matter and large % of visitors that weren’t our target market, we were happy with the extra social flow.
How to Replicate This for Your Business
While the initial traffic drivers for this were reddit and the Austin Business Journal, the topic itself was equally important. Identifying something timely that your industry or demographic is passionate about is key and even better if they’re divided on issue. This strategy works well in local markets and can easily be applied to other verticals by piggybacking on trending or controversial topics new or pending legislation, regulations, sector growth/decay, etc. If you’re including other businesses in your infographic, it’s a very good idea to let them know, ideally beforehand, so you can leverage social media for maximum amplification. If you’re going with a negative slant, consider the implications it may have on your company’s reputation, as well as how other businesses you include may feel about that, especially if you’re not 100% certain about the data you’re visualizing.
We don’t want more cars on the road than anyone else, but went positive because we love the city. Sure enough, our content inspired a negative spin-off, naturally, by a designer recently moved here.
This exercise is pure genius. Good work.